The futility of IT and the beginning of all “evil” is the performance meter. What does it tell you?
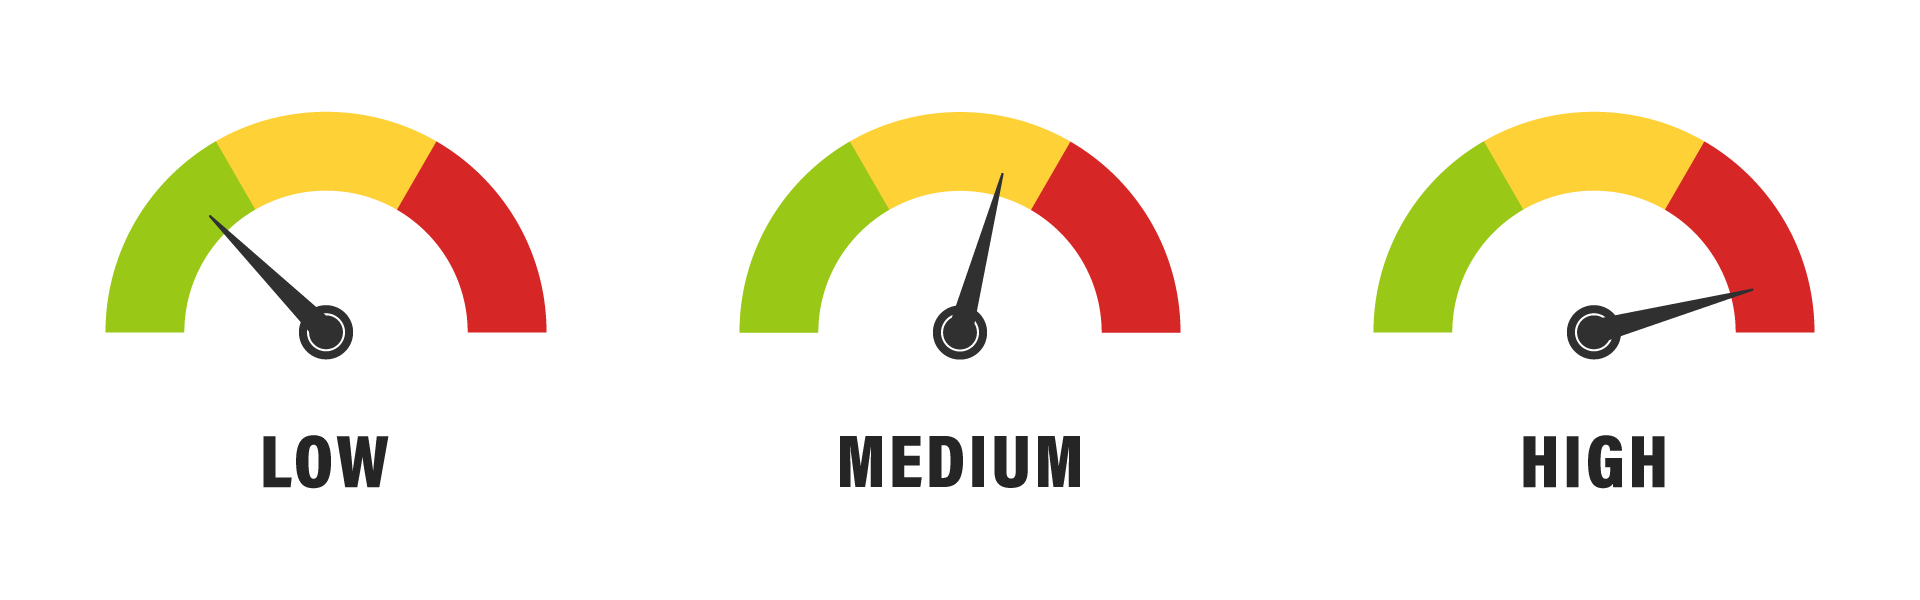
Well, of course it tells you that the services are working, that is, if the indicator is green. But it doesn’t tell you how expensive or cheap it is to produce green space, or the quality of services and applications. On the other hand, green space can also be the result of over-utilisation of resources. What about when that meter is in the red? The most common reaction is to buy more capacity. And when the meter goes back to green, we’re back to square one, which means we don’t know anything about cost-effectiveness and quality.
 Over the past few months, I have spoken to numerous service providers, technology houses, customers and experts about this issue and, in particular, why this is happening. It is at least a question of financial interests and a lack of skills and management models on various sides, and most likely a combination of both.
Why is it important to undo these things? Well, for the money, of course. It’s more than just the price of a new purchase. Often the cost analysis is focused on data centre equipment and licences, their acquisition and lifecycle costs, which are a significant part of the total cost, but often lead to the wrong conclusion.
Hardware and licenses are sized according to the services that run on them. If services are inefficiently implemented and not properly placed and scheduled on servers, the end result can be a complete disaster in terms of cost-effectiveness and performance. A performance metric will not help with these issues; much more in-depth knowledge and technology is needed.
Over the past years, we have carried out more than 200 data platform optimisation projects and 98% of them have delivered significant benefits. One interesting point often comes up: when we talk about optimising IT infrastructure, we talk generically about infrastructure, even though the main role of IT is to process data in different forms and in different ways. In our projects, measured and verified results always come from data-related analysis, needs and sizing. When these things are in place, the performance metric takes on a new meaning: it really tells us that our overall performance is in order, and that includes cost-effectiveness.
The savings potential for data platforms and databases is significant, with databases alone representing on average one third of the total cost of data centres. Based on our experience and measured results, we can typically save 30-50% of database costs when including hardware and software. A medium-sized organisation with an annual IT spend of €3M can achieve savings of €300-500,000. If the database environment is in the cloud, the savings potential is slightly lower, although still significant.
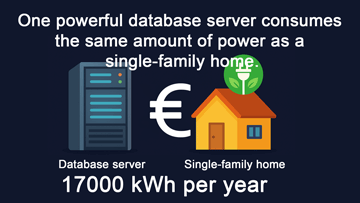
The savings are based on optimising the resources needed to run the database workloads. The overall savings are increased by a wide range of other direct and indirect savings. For example, one efficient database server consumes the same amount of electricity per year as a detached house. If we reduce the number of servers by a third, that is a significant saving in electricity consumption. Similarly, the need for cooling and other services will be reduced.
If savings are made incorrectly, performance suffers and the consequences are severe. When we talk about savings and cost-effectiveness, we mean delivering better performance at lower cost. In the vast majority of our projects, customers have achieved significant savings and clearly improved performance. This requires cutting-edge expertise and technology. Human hands, Excel and paper cannot cope with the task of analysing billions of rows of databases, parameterising workloads to a minimum and optimising forecasts based on trends.
 Since 2011, we have developed proprietary technology that focuses specifically on server and workload-specific analysis and optimisation. Our product has four approved international patents and four new ones in process. We also have a performance indicator, which I criticised at the beginning of this text, but it meets the requirements of cost-effectiveness, i.e. it gives an overview of how optimally we use the resources we have acquired. When our indicator is in the green, our customers can be confident that they are not paying for unnecessary resources – the input/output ratio is right.
A responsible organisation and responsible IT will ensure that the overall efficiency is right. The direct savings described above are part of this accountability. Our in-depth performance and capacity analytics also provide customers with direct feedback, down to the application code level, on various efficiency opportunities. When cost-effectiveness planning is taken to this level, the organization learns in a sustainable way. We bring best practices to clients at the source of development, so that applications are designed and implemented correctly from the outset. This leads to continuous improvement in IT infrastructure costs. When an organisation’s infrastructure, services and applications are as cost-effective as possible, they will also stand the test of time. In turn, they increase (rather than erode) the competitiveness of the organisation and strengthen its resilience and responsiveness to environmental change. This is our approach to best Finops practices.
Thought-provoking? Call or send a quick contact at the bottom of the page to discuss.
–Timo Lindström, CEO