

Valtteri Nättiaho
As part of a series of blogs on the different roles of data teams, in this blog I will discuss the role of the data analyst as part of the data team. The role of the data analyst can adapt and blend with that of a data scientist, data architect or data engineer depending on the project, but
in a nutshell, the main role of the data analyst is to act as a bridge builder between the business and the data team. This in itself doesn’t tell you much, so I’ll expand on this through what I think are the three most important data analyst skills.
Data-analystin tärkeimmät taidot:
- Understanding the business need behind analytics
- Data modelling from the perspective of reporting needs
- Storytelling with data
I chose these three entities for my blog also because these three entities allow us to describe at a high level how well a typical data analytics project is progressing.
Analytical testing can be carried out in a similar way to the imintatarpeen ymmärrys.
Data analytics aims to support and improve decision-making. In concrete terms, it aims to reduce guesswork in decision-making and enable informed decision-making. However, this does not mean that tacit knowledge, such as views based on experience or instinct, should disappear from the decision-making process altogether. Instead, the relationship between data and tacit knowledge will change. A glass of water serves as an allegory: if historically the “glass of water” in decision-making has contained half a pint of data and a pint and a half of mud, data analytics can help turn the situation on its head. In this case, decisions are based primarily on data, but tacit knowledge complements the analysis.
Historically, several systems have been developed to support decision making, such as Decision Support Systems (DSS) and Executive Information Systems (EIS). Today, Business Intelligence (BI) tools represent the modern data analytics paradigm. BI tools such as Power BI and Tableau are distinguished from EIS systems in particular by their ability to integrate data from multiple systems and the ability to build self-service reports. This makes BI a more flexible and user-oriented tool for decision support.
Since the goal of data analytics is to support decision making, it is important for the data analyst to understand what decisions the business is trying to make. This means that the analyst needs to be intimately familiar with the business needs and their specifics. By asking the right questions and digging deeper into the needs, the analyst can ensure that the information produced from analytics is relevant to the questions that matter to the business. This improves the effectiveness of the analysis and helps the business make informed decisions.
Data modelling from a reporting perspective
BI tools are typically the place where data from different systems is examined. For this reason, the underlying data model in BI tools is a critical part of analytics, as a poorly constructed data model makes analytics more difficult. The computational efficiency of BI tools suffers if the data model is poorly designed. This often leads to sluggish analytics and additional costs for licenses.
Data modelling is a critical part of a data project, because when data engineers, data architects and data analysts agree on what kind of data model to build for them, collaboration between them is smoother. A shared vision of how the data should be structured summarises the vision of the data project and thus enables a more efficient way of working.
The data analyst should also understand how different data models affect performance from a visualisation perspective and how tools query different data storage options. Typically, in these tools, data is either in-memory storage or real-time storage (live connection, directquery) in the data models of BI tools. In in-memory models, data is typically queried using the tool’s own technology (vertipaq, hyper, associative engine), while in real-time connections the language is often, but not always, SQL.
The type of data storage influences what the data model should be in terms of data analytics. This is most obvious when data volumes are huge and optimisation of the data model is a prerequisite for analytics. The following situation serves as an example:
Company X wants to examine its stock balances in a WMS system where stock transactions are stored cumulatively. In order to obtain the current stock balance, company X needs to calculate the stock history over a period of 10 years. This means calculating 500 million rows.
Such a scenario should raise a lot of questions for the data analyst. What is the business need? What kind of data visualisations do you want to make? At what level of granularity do you want to explore the data? Can a cumulative calculation be done on a deck? If a business wants to see data at transaction level and possibly all data in the same graph, part of the calculation needs to be done already on the data platform. If the calculation is done at the visualisation level, it is likely that the BI tool will give an error message of the following type: ” Visual has Exceeded Available Resources”/ “Out of Memory”. A solution could be, for example, a model where the data platform would cumulatively calculate the stock balances for the current month in one table and the BI tool would perform the rest of the calculation dynamically. On the other hand, if the dialogue with the business indicates that a monthly view of stock balances is sufficient to support decision making, the data can be aggregated into a monthly table. This reduces the amount of data to be processed enormously and thus solves the problem.
The data analyst must also be able to consider what kind of data model meets the business need for dimensional and factual tables. The analytics in BI tools are dynamic in nature and their operation is often dependent on the different dimensions on which the data is to be filtered. In financial analytics, a good example could be filtering by cost centre or business unit. In order for a business user to view the key figures calculated from a fact table, the dimension tables must be relationally functional. The data analyst understands what the final reporting requires for these tables and can thus communicate the requirement to the data engineer.
Storytelling with data
The aim of data analytics is to enable “eureka moments” when insights emerge from the data that can be used to make fact-based decisions. Different data visualisation methods are suitable for different types of data for this very reason.
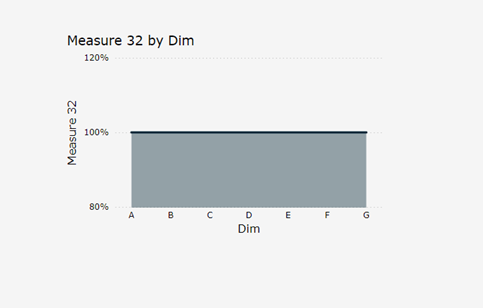
I’ve written a blog on how to choose the right visualisation type for your data, but let’s take an extreme example of how data visualisation can enable, or in this example, prevent you from making observations. The following two graphs show the same data.
Graph 1 stacked Area chart:
Graph 2 bar chart of the same data:
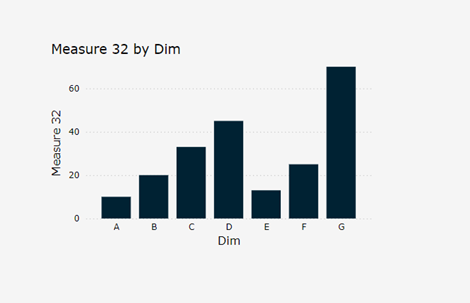
In contrast to the first graph, the data interpreter can draw conclusions from the data and its implications in the second graph. The task of the data analyst is to think about how different types of data can be presented so that practical insights can be drawn from them.
However, simply choosing the right visualisations is not enough; the data analyst must also think about the reporting package. This is especially important when a data project aims to build self-service reporting packages. Dashboards and reports should be designed in the data project so that the whole is not too “noisy”. More is often less in reporting and thinking about and following different design principles is part of the data analyst’s job.
A practical example of this in a data project is communicating the implications of choices to business representatives. It is easy to adapt to what the end user wants and build exactly the kind of reporting that the data analyst is asked for, but I think that in such a situation it is the responsibility of a good data analyst to at least communicate what the consequences are, from a data analysis point of view, if the reporting is built too complex and too full of different visualisations.
Summarum
In summary, the data analyst is a key part of the data team, and their role is to act as a bridge between the business and the data team. The key skills of the data analyst – understanding business needs, modelling data from a reporting perspective and storytelling with data – help ensure that analytics support business decision making effectively. Data analysts not only select the right visualisations and build effective data models, but also ensure that reporting is clear and practical for the end user. Well-executed analytics improves the quality of decision making and enables informed decision making that supports the strategic goals of the business.
DB Pro Services provides world-class data analysts who manage Azure and AWS platforms, as well as Databricks, Snowflake, Fabric and Synapse data platforms. Contact us to help you and your organization leverage data effectively and make better decisions!
Valtteri Nättiaho
Lead Data Analyst
Valtteri.Nattiaho(a)dbproservices.fi
LinkedIn: Valtteri Nättiaho | LinkedIn
Puhelin: +358 400 847 405
Valtteri is a deep Power BI expert who likes to solve data analytics challenges. He has experience with Power BI since 2016 and also runs the software in his spare time, when he can be found not only on the golf course but also on Fabric’s Power BI forums, where he answers Power BI problems.